(Source – Shutterstock)
Tokopedia to use graph databases to deal with fraud and risk management
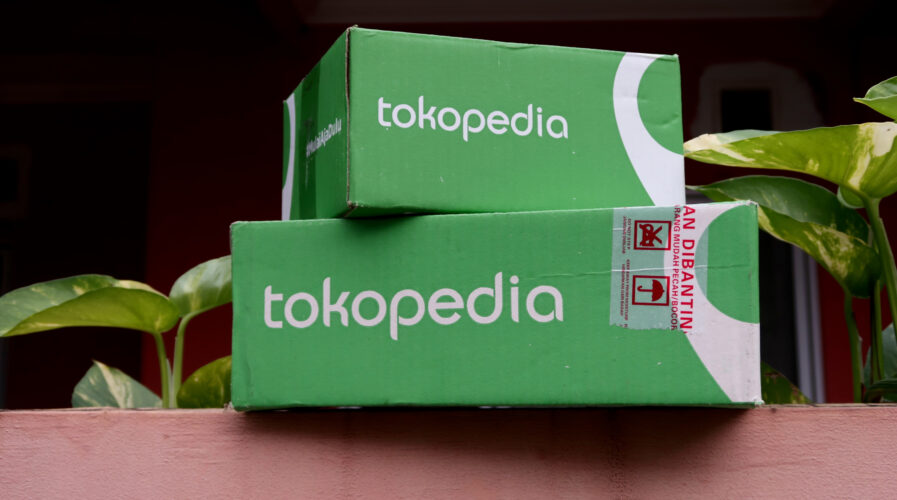
As the fourth most populated country in the world, Indonesia’s digital economy is expected to grow significantly in the next few years. Complementing the digital economy will be the digital services that are made available to consumers in the country as well.
For Tokopedia, the growth in Indonesia for the e-commerce industry has the potential to unlock more opportunities for them. However, there are still some concerns on how the digital ecosystem can remain secure, especially with fraud being a major problem for most digital services today.
According to Rajesh Gopala Krishnan, Vice President of Engineering at Tokopedia, as an Indonesian technology company built on trust, Tokopedia is committed to creating a safe and reliable digital ecosystem through collaborations with strategic partners.
“In practice, we use both in-house and external technologies to anticipate risk, which consists of proactive detection mechanisms and manual checking. For example, through our risk management team, we implement two mechanisms which are risk prevention and risk detection,” said Krishnan.
Risk prevention includes a standard operating procedure (SOP) and system limitations to ensure that potential loopholes are mitigated upfront through the design of the product itself while a robust risk detection system, with various risk parameters, identifies anomalous or fraudulent behavior. From there, Tokopedia can take firm action against irresponsible parties who misuse Tokopedia’s platform.
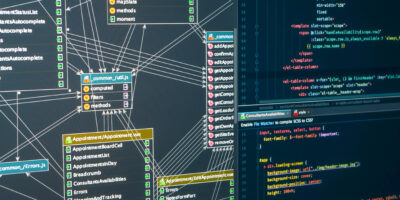
Krishnan also highlighted that Tokopedia relies on graph technology to identify potential risks, such as fraud, on its platform. This approach relies on a graph data model to build a correlation between users, new device logins, relation with other fraudulent activities, and others—which then allows us to identify potential fraud violations and account takeover attack (ATO) use cases by looking at the correlated data points.
“Detection of a fraudulent user also helps Tokopedia to prevent abusers from using new buyer promos allocations, specific promotions from categories, detect and remove banned products on our platform—thereby saving costs significantly by targeting users accurately with the promotions and right product choices, and maintain price control for the products on Tokopedia,” added Krishnan.

(Source – Shutterstock)
The rise of graph technology
Apart from fraud detection, Tokopedia also uses graph databases for analytics. Krishnan explained that compared to the relational database (RDBMS) that structures information in tables in a two-dimensional way, graph databases are an intuitive representation of the world that mimics the way humans think. As such, graphs can shift the perspective from facts to relationships, provide context to datasets, scale massively without sampling and run deep link analytics in real-time.
“To illustrate, some of the well-known use cases that leverage graph databases aside from risk prevention are recommendation engines on Tokopedia that rely significantly on relationship logic. Graphs can help with search, advertisement, and product recommendations based on location, demography, and connected users.
The many advantages of graph databases contribute to a richer and more personalized ‘hyperlocal’ experience for buyers and sellers on Tokopedia. For example, Tokopedia users from Bali will see local sellers within a certain radius, thus, helping them have more affordable access to products from the nearest sellers,” said Krishnan.
Krishan also mentioned graph databases can also compute the shortest path from the nearest warehouse to the customer and curate the list of parcels, then group them to be shipped to a particular zip code. This, in turn, will prevent incorrect routings and provide a more efficient logistics experience.
Understanding graph databases
Graph databases have actually been around for some time and have plenty of use cases. In fact, compared to machine learning which uses analytical and statistical techniques to uncover patterns in data and provide businesses with more insightful conclusions, graph databases can do a lot more as machine learning results are limited by two factors – how good is the data and how good are the analytics.
“You can’t detect a pattern in data if the pattern isn’t there or if the pattern is very weak. To succeed, your data needs to consist of millions of records, cover a variety of cases, and hopefully draw from multiple sources. In our increasingly digitized world, harvesting raw data is much less of a problem. Several challenges remain. These include:
- Feature selection – Do I have the right data?
- Data integration – How do I bring my data from multiple sources together into one unified data model?
- Analytical performance – With so much data, can I afford the computational effort?
Traditional approaches often fail due to a lack of variety of features that have a high correlation to the outcome and low volume of the training data, resulting in poor accuracy for machine learning solutions,” explained Chung Ho, Vice President of TigerGraph for Asia Pacific.
For Ho, one of the biggest obstacles to widespread artificial intelligence adoption is a lack of transparency as to how the AI system arrived at a particular decision. For example, an AI system computes and offers a mortgage with a higher rate of interest or an insurance policy with a higher premium to an applicant. The bank or insurance company needs to explain the higher rate of interest for the loan or higher premium for a policy, especially in case of litigations related to race, ethnicity, culture, or gender bias.
“Graph databases offer solutions to many of these ML data challenges. Graphs are built on the idea of connecting and traversing links, so they are the natural choice for data integration. Graphs can also enrich the raw data. In traditional tabular data, each column is one “feature” that the ML system can use. In a graph, each type of connection is an additional feature. Moreover, small graph patterns, such as causal chains, loops, and forks can themselves be considered features,” he said.
As such, Ho pointed out that machine learning features developed using TigerGraph can be used to explain clearly why the AI solution arrived at a particular decision based on the combination of the computed feature values. Moreover, Ho said TigerGraph’s GraphStudio can show how the features were computed and what led to a particular welfare claim being rejected or a higher mortgage interest rate for an applicant, or a higher premium insurance policy.
“TigerGraph ensures that the explainable AI can be rolled out to all the users within the enterprise as well as external parties such as welfare recipients, mortgage, and insurance policy applicants with real-time visualization, exploration, and analytics of interconnected data. TigerGraph’s deep link analytics means it can process datasets with terabytes of data, and traverse millions of connections in a fraction of a second,” claimed Ho.
For companies like Tokopedia, graph databases will enable them to not only improve their services but also use the insights to come up with products and offerings for their customers. Simply put, graph databases can transform the way we look at and understand data in the future.
READ MORE
- Safer Automation: How Sophic and Firmus Succeeded in Malaysia with MDEC’s Support
- Privilege granted, not gained: Intelligent authorization for enhanced infrastructure productivity
- Low-Code produces the Proof-of-Possibilities
- New Wearables Enable Staff to Work Faster and Safer
- Experts weigh in on Oracle’s departure from adland


