(Source – Shutterstock)
Are organizations finally understanding the capabilities of graph technologies?
|
Getting your Trinity Audio player ready... |
Graph technologies have been around for some time in the IT industry. Yet, despite its presence, few companies have adopted graph technology, because many organizations felt the use of graphs, especially for databases, would be complicated and could not fit their modern workloads.
This is beginning to change: today, graph technologies are seeing more use cases being developed and adopted by organizations around the world. From graph databases to graph analytics, businesses are realizing that using graphs is a lot less complicated than having multiple solutions to solve a problem.
A Gartner study stated that graph analytics are among the most underleveraged capabilities because organizations don’t understand the contrast and complementary nature of graph insights relative to relational analysis.
In fact, the study points out that complex business problems today require understanding the variable nature of connections and strengths across multiple entities such as organizations, people, or transactions. Graph technologies can do that. Organizations have also wrongly believed graph analytics are limited to niche use cases such as link analysis or social media analysis.
As such, Gartner believes that graph technologies will be used in 80% of data and analytics innovations by 2025, up from just 10% of usage in 2021. While there are companies that specifically focus on graph technologies, big tech companies have also begun advocating graph technology.
The rise of graph technologies.
For example, VMware unveiled its Aria Graph, a technology designed for the operational challenges of cloud-native applications and environments and provides access to a single source of truth that is updated in near-real time. Aria Graph is developed with an API-first approach that allows DevOps and ITOps to access a consolidated view of their applications across multiple clouds. Additionally, the graph can be accessed via Aria Hub, which provides rich, centralized views and controls to manage the entire multi-cloud environment.
Another example is AWS Neptune, a serverless graph database designed for superior scalability and availability. It allows organizations to build a fraud graph solution. A fraud graph stores the relationships between the transactions, actors, and other relevant information to enable customers to find common patterns in the data and build applications that can detect fraudulent activities. Using a fraud graph, organizations can identify a network of connected users and items such as e-mail accounts, addresses, and phone numbers that they have in common.
Apart from that, some vendors have dedicated themselves to ensuring graph technologies continue to evolve and bring out the best possibilities. This includes Neo4j and TigerGraph. Neo4j’s graph platform capabilities include aiding developers to import data to the graph, business analysts to explore the data with ease, and data scientists to make decisions based on analysis results.
TigerGraph on the other hand specializes in connecting data assets to deliver enterprise-level knowledge and insights. TigerGraph provides a graph AI platform that is built on the industry’s first and only distributed native graph database which comes with a SQL-like query language and tightly integrates tooling and enterprise connectors to ensure data scientists and developers can design and deploy analytical solutions in weeks.
Having been recently recognized in the 2022 Gartner® Magic Quadrant™ for Cloud Database Management Systems, TigerGraph Cloud is the industry’s first and only distributed native graph database-as-a-service, enabling users to accelerate the adoption of graph technology with easy-to-use features that process analytics and transactional workloads in real-time.
Understanding graph technologies use cases.
One of the most exciting use cases for graph technologies is its availability to provide multi-dimensional insights, especially for SQL databases. While traditional SQL databases are good at storing facts for easy storage and retrieval, they are not good at finding multilayer or multi-dimensional relationships which is where patterns and insights are found. Finding deep, multi-dimensional relationships and patterns are exactly what graph databases were built to do, and they do it fast.
“Graph technologies in databases, for example, is a way of showing that connection between the data sitting next to each other. It is the only kind of database right now with the available technology that is showing the connection between the data points, rather than just having the data points already existing in the traditional way,” said Serene Keng, Country Manager for Singapore and Channel & Alliances Head for Asia Pacific at TigerGraph.

Serene Keng, Country Manager for Singapore and Channel & Alliances Head for Asia Pacific at TigerGraph.
For Serene, businesses are beginning to realize that graph technologies provide “a very valuable approach to solving the problems that they have for the past few years. They’ve always been complaining but have never really been able to figure out what’s the best approach to do this, especially when they are trying to find ways to make their data work harder for them, and in the right context.”
Fraud detection.
Looking at some of the use cases, Serene highlighted how China Mobile uses TigerGraph to detect phone-based fraud in real time by analyzing the calling patterns of prepaid subscribers. Subscribers are alerted in real-time of a potential fraudster call, with high-probability fraud calls being redirected to China Mobile’s call center for investigation.
“TigerGraph’s native parallel graph database is purpose-built to address this challenge. At China Mobile, TigerGraph creates over 118 features for each phone in real-time by analyzing relationships among subscribers over time, identifying a good phone owned by a regular customer compared to a bad phone suspected to be a fraudster’s. Subscribers are alerted in real-time of a potential fraudster call, with high-probability fraud calls being redirected to China Mobile’s call center for investigation,” explained Serene.
Since using TigerGraph, China Mobile has maintained a real-time operational graph with over 600 million subscribers & 15 billion call detail records. It can analyze caller patterns with immediate call recipients as well as extended networks to compute features such as stable group, in-group connections, and three-step friend connections to find fraudsters.
It also can feed machine learning with new training data for fraud detection with 118 features per phone every two hours in real-time as well as review over 2,000 calls per second to detect fraudsters committing phone-based fraud in real-time with five-level hop analysis and improve customer satisfaction with proactive identification and blocking of fraudsters. This has led to an accuracy rate of over 80% in detecting bad phones as well as detected over three million scam calls and protected China Mobile from a potential loss of RMB40 million.

Since using TigerGraph, China Mobile has maintained a real-time operational graph with over 600 million subscribers & 15 billion call detail records. (Source – Shutterstock)
Financial crime.
Another use case example is in cryptocurrency. As cryptocurrency and blockchain increasingly become more mainstream, the ecosystem that surrounds and supports it will also develop rapidly, while increasing its prevalence of being a target for financial crime.
By constructing a cryptocurrency network graph using TigerGraph’s graph technology, Serene pointed out that Merkle Science can analyze over 2.5 TB of data in real-time to allow their customers to run queries to identify funds sent or received from different types of actors (such as darknet, exchanges, scams, and smart contracts) from a specific location or address, which can help detect and potential criminal activity. TigerGraph’s GSQL software program also helps them implement complex graph algorithms, which the company says takes much longer to implement using other incumbents.
“Merkle Science previously relied on SQL databases and the team also tried other incumbent graph solutions at first, but they did not perform well on important factors such as scalability, resiliency, and high-speed performance, especially on large datasets. With blockchain, the process of money laundering is simple. Fund transfer to multiple addresses is happening concurrently and at volume.
On the SQL database, it was impossible to visualize 5 to 10 hops depth of deep-link queries necessary to track where the funds in question originated from and eventually reached. Merkle Science needed a database that was going to be able to handle the large quantities of data it possessed. They looked at multiple competitors, but while they appeared to fare well on lower scales, they suffered issues of poor ETL performance, and most importantly – streaming writes were an expensive and time-consuming process,” explained Serene.
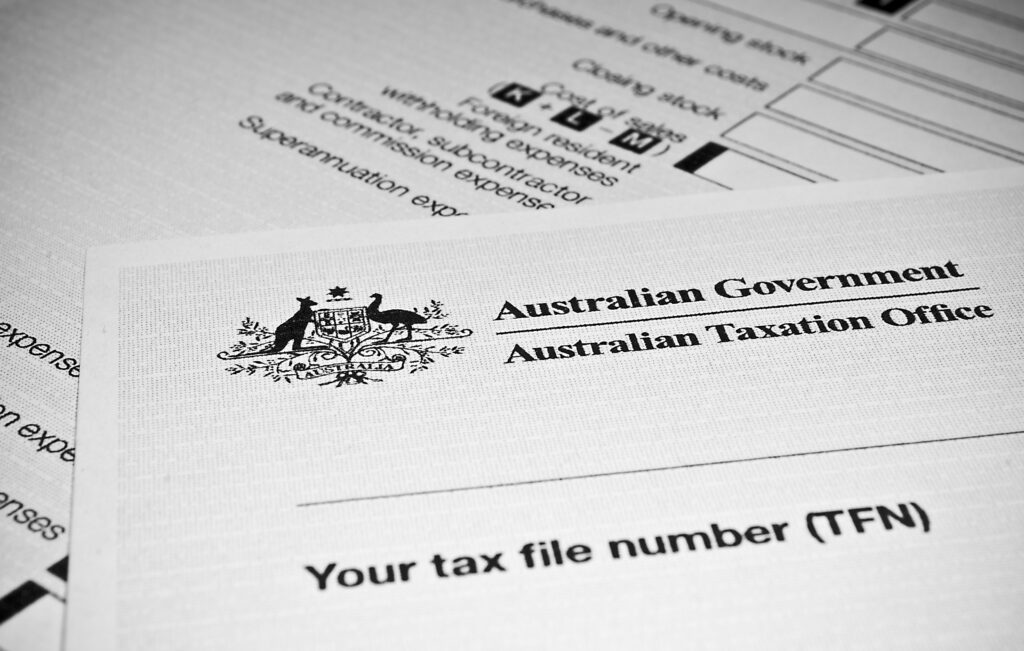
ATO selected TigerGraph because it was the only graph database that had the most comprehensive enterprise-grade capabilities and technology to process terabytes of data in a native graph construct. (Source – Shutterstock)
Tax evasion.
Another use case example for fraud detection is the Australian Taxation Office (ATO). The ATO has a massive collection of financial transactions of all its citizens and companies. However, with the complexity of data and its interrelationships, they have realized that graph database technology is the next step in their data analytics journey. Without a graph database, they are not able to map out the complexity and relationships of the transactions to detect any possible tax-related frauds or evasions.
According to Serene, after an extensive RFP and comparison, ATO selected TigerGraph because it was the only graph database that had the most comprehensive enterprise-grade capabilities and technology to process terabytes of data in a native graph construct. TigerGraph would be the foundational platform in their network analytics solution known as ANGIE, which has been designed to help ATO’s tax avoidance taskforce to discern complex and multi-layered relationships. ANGIE – also known as the automated network and grouping identification engine – will allow the task force to visualize and analyze “large and complex networks of relationships”. It will do this using data from the ATO’s Teradata enterprise data warehouse and Cloudera enterprise data hub.
The graph database, which will be used to represent complex networks, is expected to handle terabytes of data relating to entities (nodes) and their relationships (edges). TigerGraph gave ATO the ability to uncover relationships 15-20 connections deep, whereas traditional databases and other graph vendors were only able to connect three steps.
With that said, Serene believes that over time, businesses would be able to master the way they use and manipulate graph technologies to eventually replace a traditional database.
“It’s not going to be easy to unlearn things. There will be new and not-so-new technologies. You can solve different layers and aspects of challenges faced and recognize that not all data problems need a graph solution. But for those that need a graph approach, we are simply the best choice,” concluded Serene.
READ MORE
- Safer Automation: How Sophic and Firmus Succeeded in Malaysia with MDEC’s Support
- Privilege granted, not gained: Intelligent authorization for enhanced infrastructure productivity
- Low-Code produces the Proof-of-Possibilities
- New Wearables Enable Staff to Work Faster and Safer
- Experts weigh in on Oracle’s departure from adland